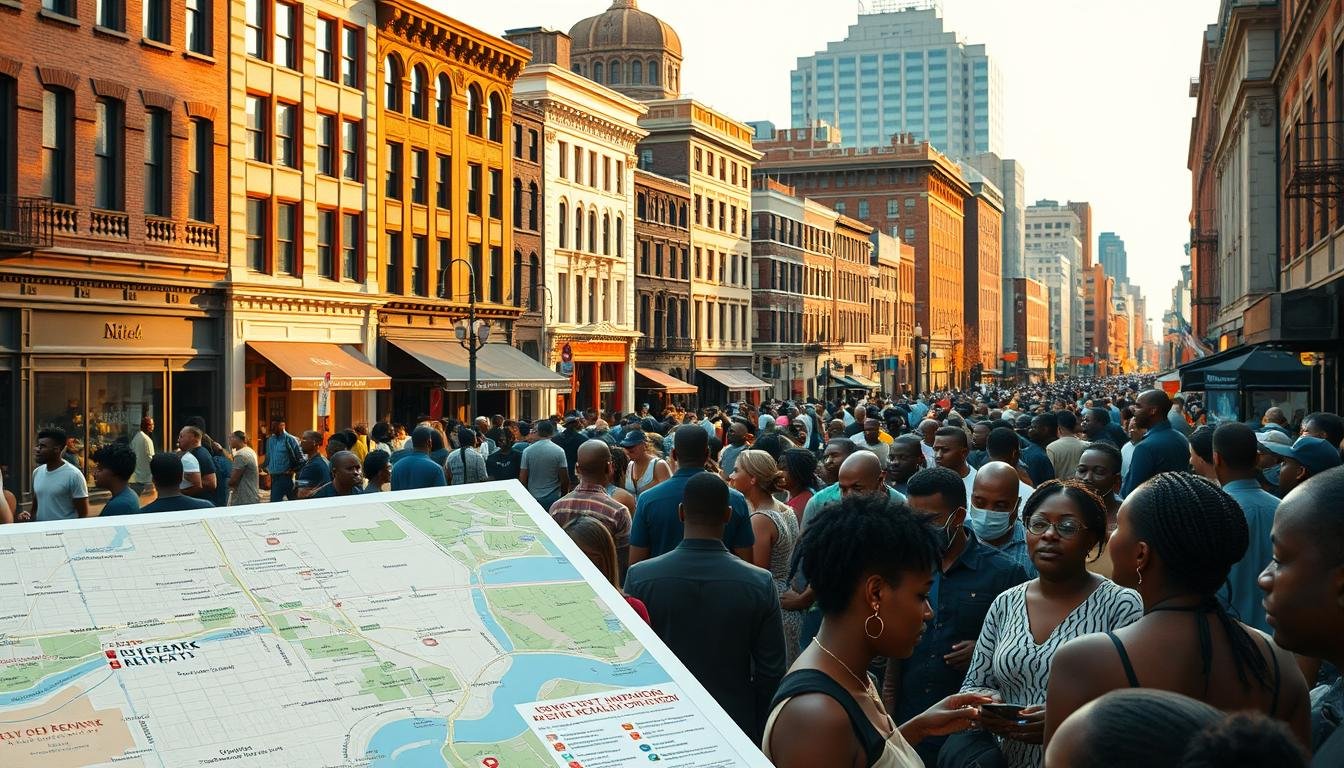
This case study examines how planned clearance reshaped a vital commercial spine and its surrounding community. From the 1950s through July 1967, citywide clearance removed 2,423.5 acres and displaced 46,000 residents. The program spent $128 million in federal funds and $53 million locally, yet the housing tally shows a net loss of 3,075 units after 14,536 were demolished and 11,461 built.
The disruption was uneven. Seventy-seven percent of those displaced were Black in a city that was 34.1% Black and 65.6% White in 1960. Two-thirds of displaced families moved no farther than 12 blocks, concentrating strain on nearby neighborhoods and small shops.
Policy promises touted higher-quality development and a larger tax base, but many cleared sites stayed vacant for years—most notably the former Westinghouse site near Broad Street Station. The article relies on archival counts and planning records, including detailed figures available in archival records (archival records), to ask who moved, where they went, and what the city actually built.
Key Takeaways
- Scale of clearance: 2,423.5 acres cleared and 46,000 displaced by July 1967.
- Racial impact: 77% of those displaced were Black, signaling disproportionate effects.
- Housing shortfall: Demolitions exceeded construction, leaving a net loss of 3,075 units.
- Local crowding: Most families moved within 12 blocks, intensifying pressure on nearby neighborhoods.
- Broken promises: Federal and local funds did not translate into timely or equivalent replacement housing.
Setting The Stage: Newark’s High Street, Urban Renewal, And A City At A Crossroads
Mid-century planning decisions set in motion a wave of demolition and rebuilding that altered daily life for thousands. This section frames the study’s scope, data sources, and methods so readers can weigh promises against outcomes.
Scope, Timeframe, And Case Study Objectives
The analysis focuses on the main corridor and adjacent areas within the city’s clearance footprint from the late 1940s through July 1967. The chosen time captures the decisive phase of demolition, clearance, and early rebuilding.
The study aims to measure what urban renewal promised versus what it delivered for local community life and small commerce. It centers on whether planning decisions preserved or displaced neighborhood functions and customer flows.
Data Sources And Methodological Notes
Primary records include housing authority counts and public library archives. Demographic context uses a 1960 baseline: 34.1% of the population identified as Black and 65.6% as White.
- Displacement: 46,000 people and 47,272 families (two thirds moved within 12 blocks).
- Acreage and funds: 2,423.5 acres cleared with $128M federal and $53M local spending.
- Housing math: 14,536 units demolished and 11,461 built (net -3,075).
“Official counts capture direct displacements but understate secondary crowding and market reactions.”
Methodology emphasizes cross-checking official tallies and situating corridor change within citywide patterns. It notes limits: statistics miss many social effects and longer-term shifts in nearby neighborhoods.
How Urban Renewal Worked In Newark: Policies, Projects, And Planning Assumptions
City planners framed clearance as a technical fix: remove blight, assemble parcels, and invite new investment. The official pitch promised higher-quality development, increased tax revenue, and modern services. In practice, the program prioritized demolition and land assembly funded by public dollars.
From “Slum Clearance” To “Higher-Quality” Development: The Official Rationale
Planners labeled targeted blocks as blighted to justify clearance. Public authorities used that designation to acquire property and clear sites for anticipated private rebuilding.
The approach assumed market-led construction would follow quickly, producing commercial and residential upgrades that the city alone could not finance.
Mechanisms Of Demolition, Clearance, And Expected Private Investment
The government bore demolition and site-preparation costs, while private developers were expected to fund vertical construction. Only public housing combined demolition and publicly funded rebuilding.
This split created a financing gap: cleared land often sat unused until developers found it profitable to build.
Timeline To July 1967 And Government Roles In Funding
By July 1967, federal funds totaled $128 million and local spending reached $53 million. These sums covered demolition, clearance, and land assembly across many project areas.
- Sequence risk: Demolish first, build later left holes in the urban fabric.
- Scale: 2,423.5 acres cleared and 46,000 people displaced by the cutoff date.
- Assumption failure: Private construction lagged, delaying promised community benefits.
| Project Area | Displaced | Acreage | Primary Funding Role |
|---|---|---|---|
| Old Third Ward | 13,000 | 224.9 | Federal + Local (clearance) |
| Rutgers / NJIT Campus | 2,658 | 57.0 | Mixed (clearance) |
| Industrial River | 1,575 | 1,528.5 | Federal (land assembly) |
| UMDNJ Medical Center | 3,163 | 54.2 | Public-funded clearance |
Newark High Street Black Business Corridor Erased By Urban Renewal Projects
Demolition fractured an ecosystem of services, networks, and informal supports that sustained shops and residents.
Displacement Disproportionality: 77% Black In A 34.1% Black City
By July 1967, 46,000 people were displaced citywide. Thirty-five thousand of those displaced were Black, or 77% of the total, despite the city’s 1960 population being 34.1% Black.
Where Clearance Hit Hardest: Black Neighborhoods And The “Closed Ghetto”
Clearance concentrated in predominantly Black neighborhoods labeled as “slums.” That geography reinforced a closed ghetto pattern of limited mobility and constrained housing options.
Short Moves, Big Consequences: Two-Thirds Relocated Within 12 Blocks
Approximately two thirds of 47,272 displaced families moved no farther than 12 blocks. Short moves intensified crowding in adjacent areas and strained local services.
Cumulative Human Impact: 46,000 People Displaced Citywide
- The ratio equates to roughly 25 out of every 100 Black residents displaced versus 4 out of every 100 White residents.
- Loss of residents reduced foot traffic and undercut the corridor’s customer base.
- Cleared land often sat idle, fragmenting property holdings and delaying recovery.
“The cumulative effect was less a temporary clearing than a long-term rupture in local supply, demand, and social support.”
The Price Of Clearance: Acres, Public Funds, And Vacant Land
Mass land assembly created contiguous tracts meant to attract builders, but the market response proved uneven and slow. The section quantifies how much was cleared, how much was spent, and what remained empty when private construction lagged.
2,423.5 Acres Cleared, $128M Federal And $53M Local Spent By 1967
Totals By July 1967: 2,423.5 acres (3.8 square miles) cleared, with $128 million federal and $53 million local funds—roughly $181 million in public outlays. The government prioritized demolition and land assembly to create parcels for future building.
| Project Area | Acreage | Federal ($M) | Local ($M) |
|---|---|---|---|
| Old Third Ward | 224.9 | 14.898 | 6.333 |
| Central Ward | 94.6 | 10.337 | 4.968 |
| Rutgers / NJIT | 57.0 | 7.838 | 3.499 |
| UMDNJ Medical Center | 54.2 | 13.596 | 3.471 |
| Industrial River | 1,528.5 | 7.919 | 3.794 |
When Private Capital Didn’t Arrive: The Westinghouse Site As A Lingering Void
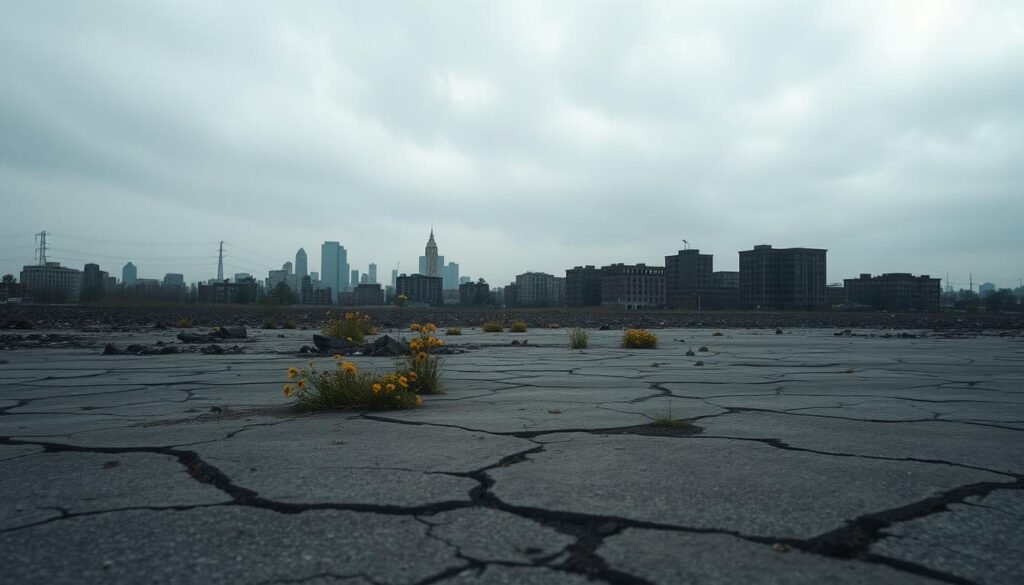
The former Westinghouse site beside Broad Street Station illustrates the gap. Despite formal redevelopment status, this prominent site sat vacant for more than 14 years.
Vacancy on transit‑adjacent land meant lost tax revenue, depressed nearby values, and reduced foot traffic for corridor businesses. That single example shows how renewal projects can stall when finance and demand do not align.
- Concentration: Large sums focused on land preparation in a few areas rather than immediate construction.
- Risk: The city absorbed staging risk; cleared parcels accumulated faster than builders arrived.
- Lesson: Urban renewal projects that separate clearance from guaranteed construction can produce long-term liabilities instead of gains.
Housing Math And Community Reality: Units Lost, Units Gained, And Who Benefited
The housing ledger shows a mismatch between demolition schedules and the arrival of new units. Through July 1967, 14,536 units were demolished and 11,461 built, a net loss of 3,075 units.
By The Numbers: 14,536 Units Demolished, 11,461 Built, Net Loss And Delays
Project balances vary widely. Old Third Ward removed 3,446 units and added 6,636 (net +3,190). Rutgers/NJIT lost 1,176 with no immediate replacement. Several UMDNJ areas and Rutgers-linked sites show large demolitions and zero new units at the cutoff.
New housing often arrived years after demolition and in different neighborhoods. This timing gap forced many residents into temporary housing and strained the community banks, schools, and small shops that once relied on nearby households.
| Project Area | Demolished | Built | Net |
|---|---|---|---|
| Old Third Ward | 3,446 | 6,636 | +3,190 |
| Rutgers / NJIT | 1,176 | 0 | -1,176 |
| UMDNJ Fairmount | 1,406 | 0 | -1,406 |
| Central Ward | 1,758 | 860 | -898 |
“One-for-one” replacement claims obscured long delays and relocations that fractured daily life.
Reliance on private construction funding left many gaps. The resulting shortage reduced foot traffic and slowed retail recovery. Who benefited varied; new units were often occupied by people moving within the city, but the slow pace limited relief for displaced residents and the broader renewal promise.
Conclusion
This case shows how large clearance often outpaced any plan for coordinated rebuilding. Between the program’s start and July 1967 the city cleared 2,423.5 acres, displaced 46,000 people, and spent about $181 million while building 11,461 units against 14,536 demolished. Two thirds of 47,272 families moved within 12 blocks.
The evidence shows that urban renewal too often prioritized land assembly over synchronized construction. That way of working fractured neighborhoods and weakened local business ecosystems. Prolonged vacant parcels, including the Westinghouse site, depressed nearby property and foot traffic.
Future work in cities should secure financing, phase demolition with guaranteed construction, protect residents and small business, and use interim uses for idle sites. For more context on related transport and displacement history, see the interstate highways history.
