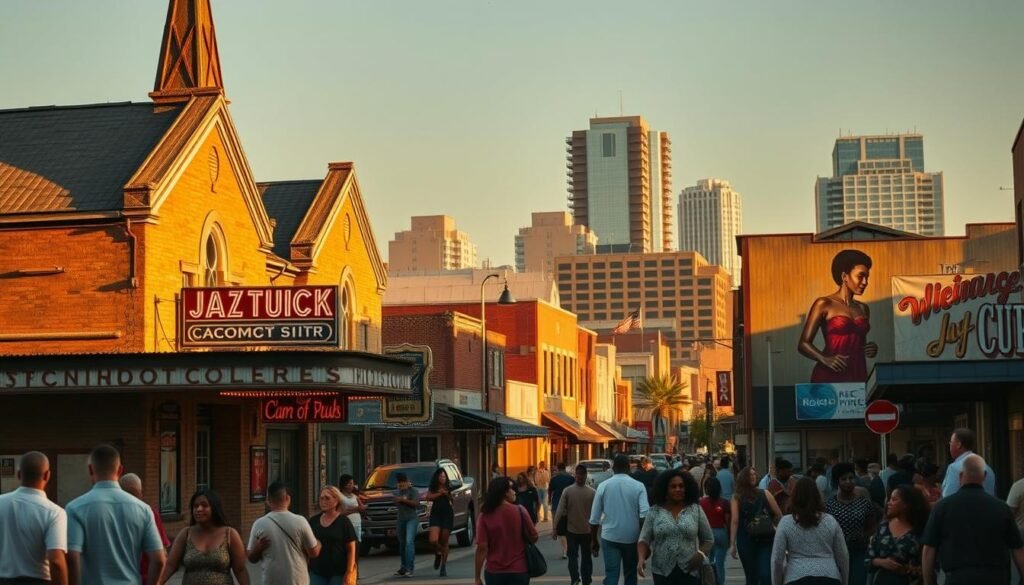
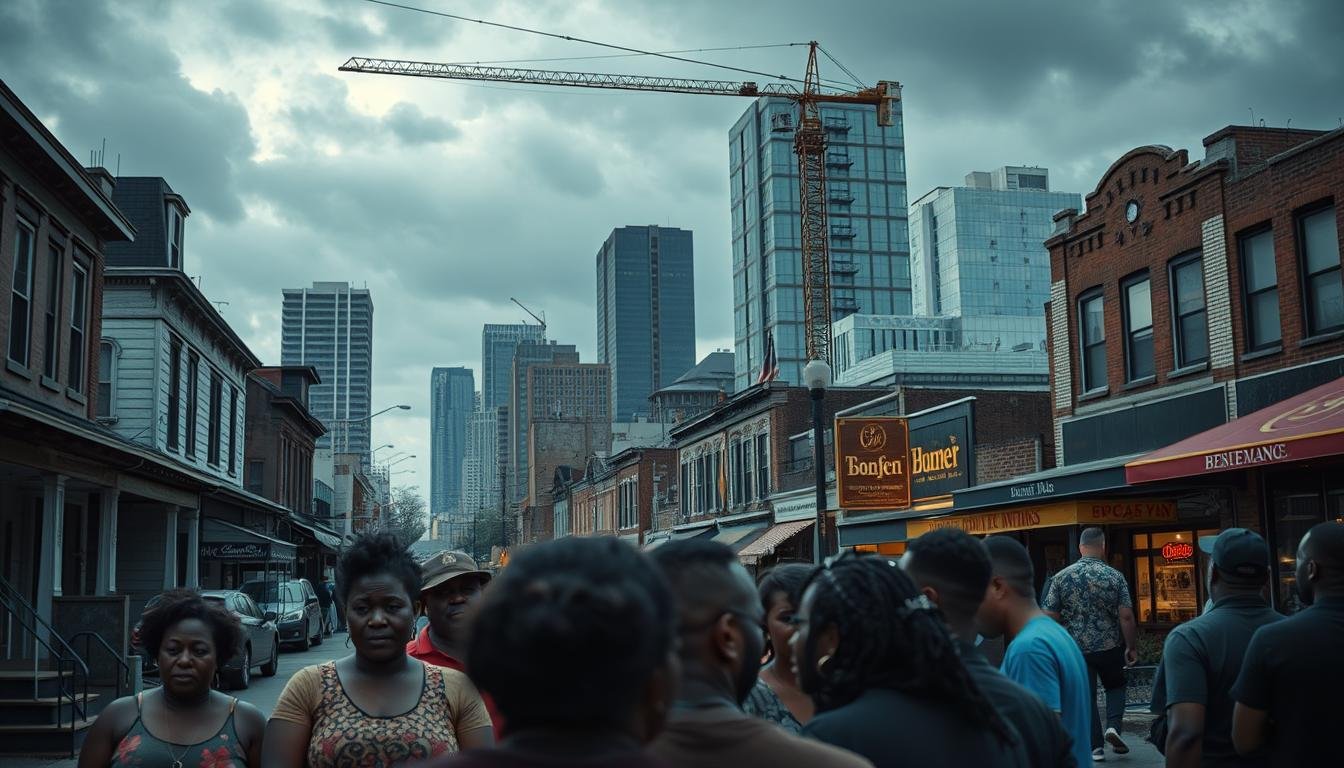
The neighborhood stands at a crossroads where market forces reshape streets once defined by long-standing ties and traditions.
Recent shifts show a notable drop in African American residents and a rise in new, wealthier arrivals. Local leaders report rising taxes, demolitions, and scarce affordable replacements that put many renters at risk.
This piece examines who gains and who pays as property values climb, and how changes in population, jobs, and housing affect daily life for people rooted in the area.
The analysis blends numbers with on-the-ground testimony to map patterns of redevelopment and their effects on small businesses, cultural institutions, and family stability.
For detailed demographic figures and trends, see a recent analysis of the neighborhood’s shifts from Kinder Institute Urban Edge.
Key Takeaways
- Population shifts have reduced long-term resident shares while new residents increase pressure on housing.
- Rising property taxes and redevelopment risk displacing renters and small business owners.
- Affordable housing supply has not kept pace with demolitions and new demand.
- Quantitative data and community voices together reveal who benefits and who bears costs.
- Policy choices now will shape whether growth includes protections for existing families and institutions.
Scope, Trend Lens, And Why This Report Matters Now
Neighborhood change unfolds unevenly; this report tracks patterns across years to separate local causes from citywide trends. The analytical scope is neighborhood-level and data-informed, focused on the area inside I-610 and comparable surrounding neighborhoods over roughly two decades.
The lens centers on demographic changes, housing market indicators, and development activity. It measures population composition, tenure, sales prices, and construction rates to reveal how small shifts compound over time.
The report pairs quantitative measures with resident testimony to show how social connections and place identity affect stability. It places the study area among peer neighborhoods to distinguish city drivers from localized outcomes.
- Comparative years and population benchmarks track evolving composition and costs.
- Early-stage development and uneven investment often precede visible change in tenure and business mix.
- Findings draw on countywide housing trend research available in a concise thesis on regional patterns: countywide housing trend research.
Why it matters now: trends are compounding. Without timely policy and practice, inequities linked to gentrification and demographic shifts will harden, altering who benefits from new development and who bears the costs.
Historical Context: A Historically Black Community’s Roots And Significance
The neighborhood’s civic rise began in the 1920s when leaders invested in institutions that anchored daily life for long-term residents.
From Freedmen’s Town To Third Ward: Institutions, Legacy, And Sense Of Place
Emancipation Park, Texas Southern University, Unity Bank, Riverside Hospital and the El Dorado Ballroom formed a local backbone. These anchors supported education, health care, finance, and culture for decades.

The area linked nearby black neighborhoods and black communities through shared institutions. Residents built economic networks and deep intergenerational connections that sustained population stability despite barriers.
“Local businesses and cultural venues acted as both engines of the economy and keepers of memory, shaping how change is felt today.”
This history explains why current development pressures carry high stakes for preservation and community control. It also sets a baseline to measure how gentrification reshapes who benefits.
| Institution | Founding Era | Primary Role |
|---|---|---|
| Emancipation Park | Late 19th Century | Public space and cultural gatherings |
| Texas Southern University | 1920s | Higher education and civic leadership |
| Unity Bank / Riverside Hospital | Early–Mid 20th Century | Financial services and healthcare access |
For deeper institutional histories, see a concise historical analysis, and context on similar centers in other regions at modern Black Wall Streets.
Demographic Changes And Educational Attainment In The Third Ward
Census figures show notable population turnover in recent years, reshaping neighborhood demographics and local institutions.
U.S. Census Signals: Fewer Black Residents, Rising White And Hispanic Populations
The U.S. Census captures a clear pattern: the Greater Third Ward saw its African American share fall by more than 10% over the last decade.
At the same time, the white population roughly doubled, and Hispanic/Latino numbers rose. These shifts change voting blocs and civic voice within the city.
Racial And Ethnic Composition Shifts Across Two Decades
County-level analysis from 2000 to 2018 shows similar movement in peer neighborhoods. Losses among long-term black residents coincided with gains by Hispanic/Latino and some white residents.
These demographic shifts recast neighborhood identity and influence demand for services, schools, and local businesses.
Higher Education Levels And University Influence On Population Mix
The area reports the highest share of residents with higher education among four gentrifying communities—about 25%—driven in part by two large public universities nearby.
That rate remains below the county median of 31%. Rising educational attainment links to changes in age, income, and housing preferences.
| Measure | Third Ward Area | County Average |
|---|---|---|
| Change in African American Share (Past Decade) | -10%+ | -5% |
| White Population Change (Past Decade) | +100% (approx.) | +30% |
| Share With Higher Education | ~25% | 31% |
Interpretation: Population turnover intersects with rising housing prices, altering income mixes and consumption patterns. Without targeted policy, gains in educational attainment may not produce equitable housing access or stable incomes for longtime residents.
Housing Tenure, Renters, And Affordability Pressures
Rising renter shares have turned tenure dynamics into a central driver of neighborhood change.
Across four gentrifying neighborhoods, a clear majority of units are renter-occupied. In the Third Ward one in four residents owns a home, far below the county rate.

Majority Renters And Cost-Burdened Households
Most renters face cost burdens because local incomes lag. Low median earnings—about half the county—push rent to an unsustainable share of pay.
Income Levels, Median Household Income, And Rent Burdens Over Time
Declining income levels in three of four communities raised rent pressure even before recent market shifts. Growing demand for units outstrips supply, worsening stress for long-term residents.
Homeownership Barriers For Black Residents And Longtime Neighbors
Credit limits, rising prices, and scarce affordable housing reduce paths to ownership. Tenure change increases turnover, weakens social ties, and heightens vulnerability to speculative acquisition.
- Implication: With more renters, displacement risk rises as gentrification accelerates.
- Policy: Preservation, subsidies, and tenant protections can stabilize population and housing outcomes.
For research on tenure and market impacts see the gentrification literature review.
Property Values, Housing Prices, And Property Taxes
Rising sale prices and sparse new construction have combined to tighten housing options for local households. This section links market movement to tax effects and who bears the cost.
Median Sales Price Trajectories In Peer Neighborhoods
Median sales in 2018 varied sharply by neighborhood. Fifth Ward and Independence Heights exceeded the county median, while Third Ward and Sunnyside trailed.
| Neighborhood | Median Sales Price (2018) | Difference From County Median |
|---|---|---|
| Fifth Ward | $279,900 | +$59,900 |
| Independence Heights | $269,990 | +$49,990 |
| Third Ward Area | $201,040 | −$18,960 |
| Sunnyside | $148,950 | −$71,050 |
| County Median | $220,000 | — |
Property Tax Pressures And Implications For Displacement
Community leaders report that rising property values increase property taxes. Higher assessments push monthly costs up for low-income homeowners and cost-burdened renters alike.
“Assessment growth turned routine tax bills into a new carrying cost that many long-term owners cannot absorb.”
Limited development and a small number of new homes keep demand high and prices elevated. Demolitions without affordable replacement shrink options for residents seeking to stay.
- Who Is Hurt: Fixed-income owners face tax strain; renters face higher market rents.
- Relief Options: Exemptions, circuit breakers, and preservation can stabilize carrying costs.
- Outcome Risk: If unchecked, rising valuations and tax bills accelerate tenure turnover.
Development Patterns And The Built Environment
Permit records and demolition logs show an uneven pace of work across nearby neighborhoods. New construction tends to cluster in wealthier blocks while many long-tenured areas wait for infill.

Permits, Demolitions, And Slow Infill On Vacant Lots
County analysis finds that permit activity concentrated in higher-value pockets. In contrast, the Third Ward saw relatively fewer new homes despite a high rate of demolitions.
Built environment effects are visible: vacant lots fragment streetscapes and make services uneven over years. These gaps extend the period before any new housing meets local demand.
“Demolitions without timely replacement turn familiar blocks into long-term construction zones before benefits arrive.”
| Measure | Wealthier Areas | Gentrifying Areas | Long-Tenured Blocks |
|---|---|---|---|
| Permit Activity | High | Medium | Low |
| Demolition Rate | Medium | High | High |
| Vacant Lots | Low | Medium | High |
| New Homes Delivered | High | Low | Low |
Residents often face noise, traffic, and loss of familiar structures before upgrades appear. Policy levers in the city can steer development toward affordability and context-sensitive design.
- Implication: Limited supply of new housing sustains demand and accelerates gentrification pressures.
- Action: Faster permitting, targeted subsidies, and preservation can reduce time lags and stabilize population outcomes.
Houston Third Ward Gentrification Cultural Displacement And Black Community Loss
Longtime merchants report sudden shifts in customer profiles that shrink day-to-day revenue and reshape local retail corridors.

Economic Displacement: Businesses, Leasing Vulnerabilities, And Customer Base Shifts
Many businesses operate on short leases. That leaves them exposed when commercial rents jump. Lease renewals often force legacy shops to close or relocate.
Local accounts note that changing spending patterns—driven by higher-income arrivals and a growing white population—reduce regular patrons for long-standing vendors.
Cultural Displacement: Community Landmarks, Social Ties, And Identity
Anchors like Emancipation Park, the El Dorado Ballroom, and KCOH radio embody neighborhood memory.
“These places keep memory alive; lose them and you lose context.”
When landmarks lose surrounding networks, the black community feels identity pressure and public space use shifts.
Resident Experiences: Evictions, Mobility To South Union, South Park, And Greenspoint
About 75% of residents are renters, a majority that raises vulnerability to eviction notices and demolitions.
- Evictions and demolition-driven moves push families to South Union, South Park, and Greenspoint.
- The racial economic shift alters who opens shops, who shops locally, and which services survive.
- Policy options include stabilizing commercial tenancy and expanding ownership paths to protect homes and small business continuity.
Community Responses, Policy Options, And Equitable Development
Local organizers have responded with coordinated plans that center resident voices in decisions about change.
The Emancipation Economic Development Council coordinates faith groups, nonprofits, CDCs, small businesses, and public agencies to build community-led plans. Leaders stress that rising property values and tax pressure reshape who can stay in the third ward.
Emancipation Economic Development Council And Community-Led Planning
The council gathers local stakeholders to set priorities for new development. It promotes resident control over land use and supports small-site acquisition to keep local shops and institutions viable.
Historic District Designation, Affordable Housing Supply, And Anti-Displacement Tools
Leaders advocate exploring historic district designation to protect neighborhood context while expanding affordable housing. They also back land trusts, inclusionary tools, tenant protections, and targeted aid for homeowners facing tax shocks.
- Focus: Preserve existing housing and boost supply where incomes lag.
- Partners: City agencies, local groups, and regional funders to scale solutions for historically black areas and black neighborhoods.
- Resources: See the policy landscape report and lessons on rebuilding economic centers at rebuilding economic centers.
“Community-led tools offer the best chance to align development with local priorities.”
Data Sources, Methods, And Limitations
This section summarizes sources and how measures were built to track demographic changes and housing trends in the study area.
Core Sources: Analysis relies on U.S. Census tabulations and county-level housing trend work covering multiple years. Local reporting and stakeholder interviews provide qualitative context.
Measures Defined: Key measures include population counts and shares, the number of renter versus owner households, median sales prices, and educational attainment levels at the neighborhood level.
“Quantitative indicators reveal patterns; resident accounts explain how those patterns affect daily life.”
| Measure | Source | Time Frame |
|---|---|---|
| Population Counts & Shares | U.S. Census | 2000–2018 |
| Renter vs Owner Numbers | County Housing Data | Multiple Years |
| Median Sales Prices | Property Records | Yearly |
Limitations: Data lag, boundary mismatches across neighborhoods, and undercounts can bias results—especially for the most vulnerable residents.
Methods triangulate numerical signals with interviews to interpret demographic shifts and racial ethnic changes without overstating causality in gentrification patterns for the third ward.
Conclusion
The neighborhood stands at an inflection point where market demand, policy choice, and local action will determine who benefits from change.
Data show clear population shifts, rising housing prices, and higher education levels that reshape economic opportunity and daily life. Residents face mounting pressure from property values and limited affordable options.
Durable improvement requires aligning housing supply, preservation tools, and renter protections with income realities. Support for small businesses, legacy institutions, and tracking educational attainment will help keep the community intact.
Practical steps—scale affordable production, deploy anti-displacement policies, and center resident-led planning—offer a way for the city and partners to balance growth with equity as demographic shifts continue.
